User's guide
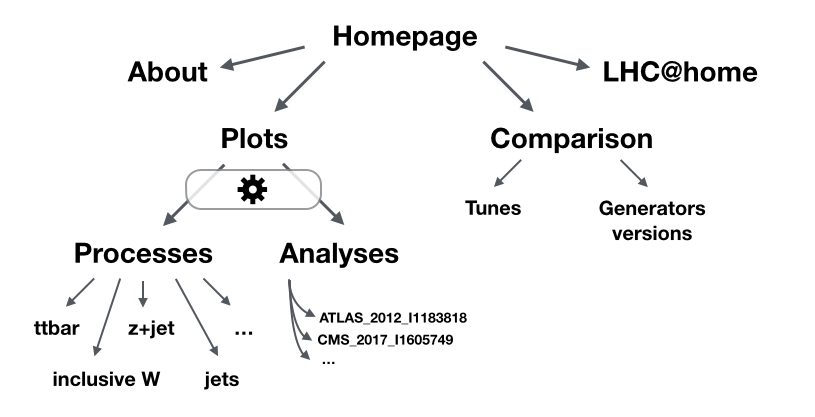
Plots
Once you select a process or data analysis, you will be taken to a page with plots; choose a variable to show in the left menu. Here you are, you can see all plots for the requested variable at different energies. By clicking on the "details" link under each plot you can download it, see the corresponding generator card or access the publication with this plot.
By default, a certain set of generators/versions/tunes are shown on distributions, it is possible to change this set and to choose another one from prepared presets or even to choose your preferred generators/versions/tunes to show for the given distribution. This may be done via the Preset and Customize buttons on each PLOTS page.
By default, the latest generator versions are shown on distributions. It is possible to change this default version for all the distributions by selecting corresponding versions in the "Generators versions" section on the main PLOTS page. Note that this choice is applied to all distributions until you quit the PLOTS section.
Comparison
Generators' versions in the table are shown in chronological order, and the "Δ" column is added to check the changes between them. This Δ represents the difference between χ2.
The background color of each sub-cell reflects its chi2 value. White cells correspond to a non-calculated χ2, due to different number of bin in theory and data histograms, for example.
To make χ2 values more physically meaningful, the MC predictions are assigned a flat 5% 'theory uncertainty', as a baseline sanity limit for the achievable theoretical accuracy with present-day MC models. A few clear cases of GIGO are excluded, but some problematic cases remain. Thus, e.g., if a calculation returns a too small cross section for a dimensionful quantity, the corresponding χ2 value will be large, even though the shape of the distribution may be well described.